BEAM Metrics in ClickHouse
At Knock, we're big into observability. Who isn't! We're also huge fans of ClickHouse. This post is an overview of how we started using ClickHouse to collect detailed, high-cardinality BEAM metrics for all sorts of reasons.
We use Datadog for all of our metrics (and monitoring, and logging!). AWS metrics, database metrics, Kubernetes, application—all of it ends up in Datadog. We know how to use the tool and generally find it pleasant. However, you pay for that. It's not like this is a hot take: Datadog is ✨expensive✨.
The thing we pay the most for is definitely custom metrics, that is, unique combinations of metric name and tag values. A classic example:
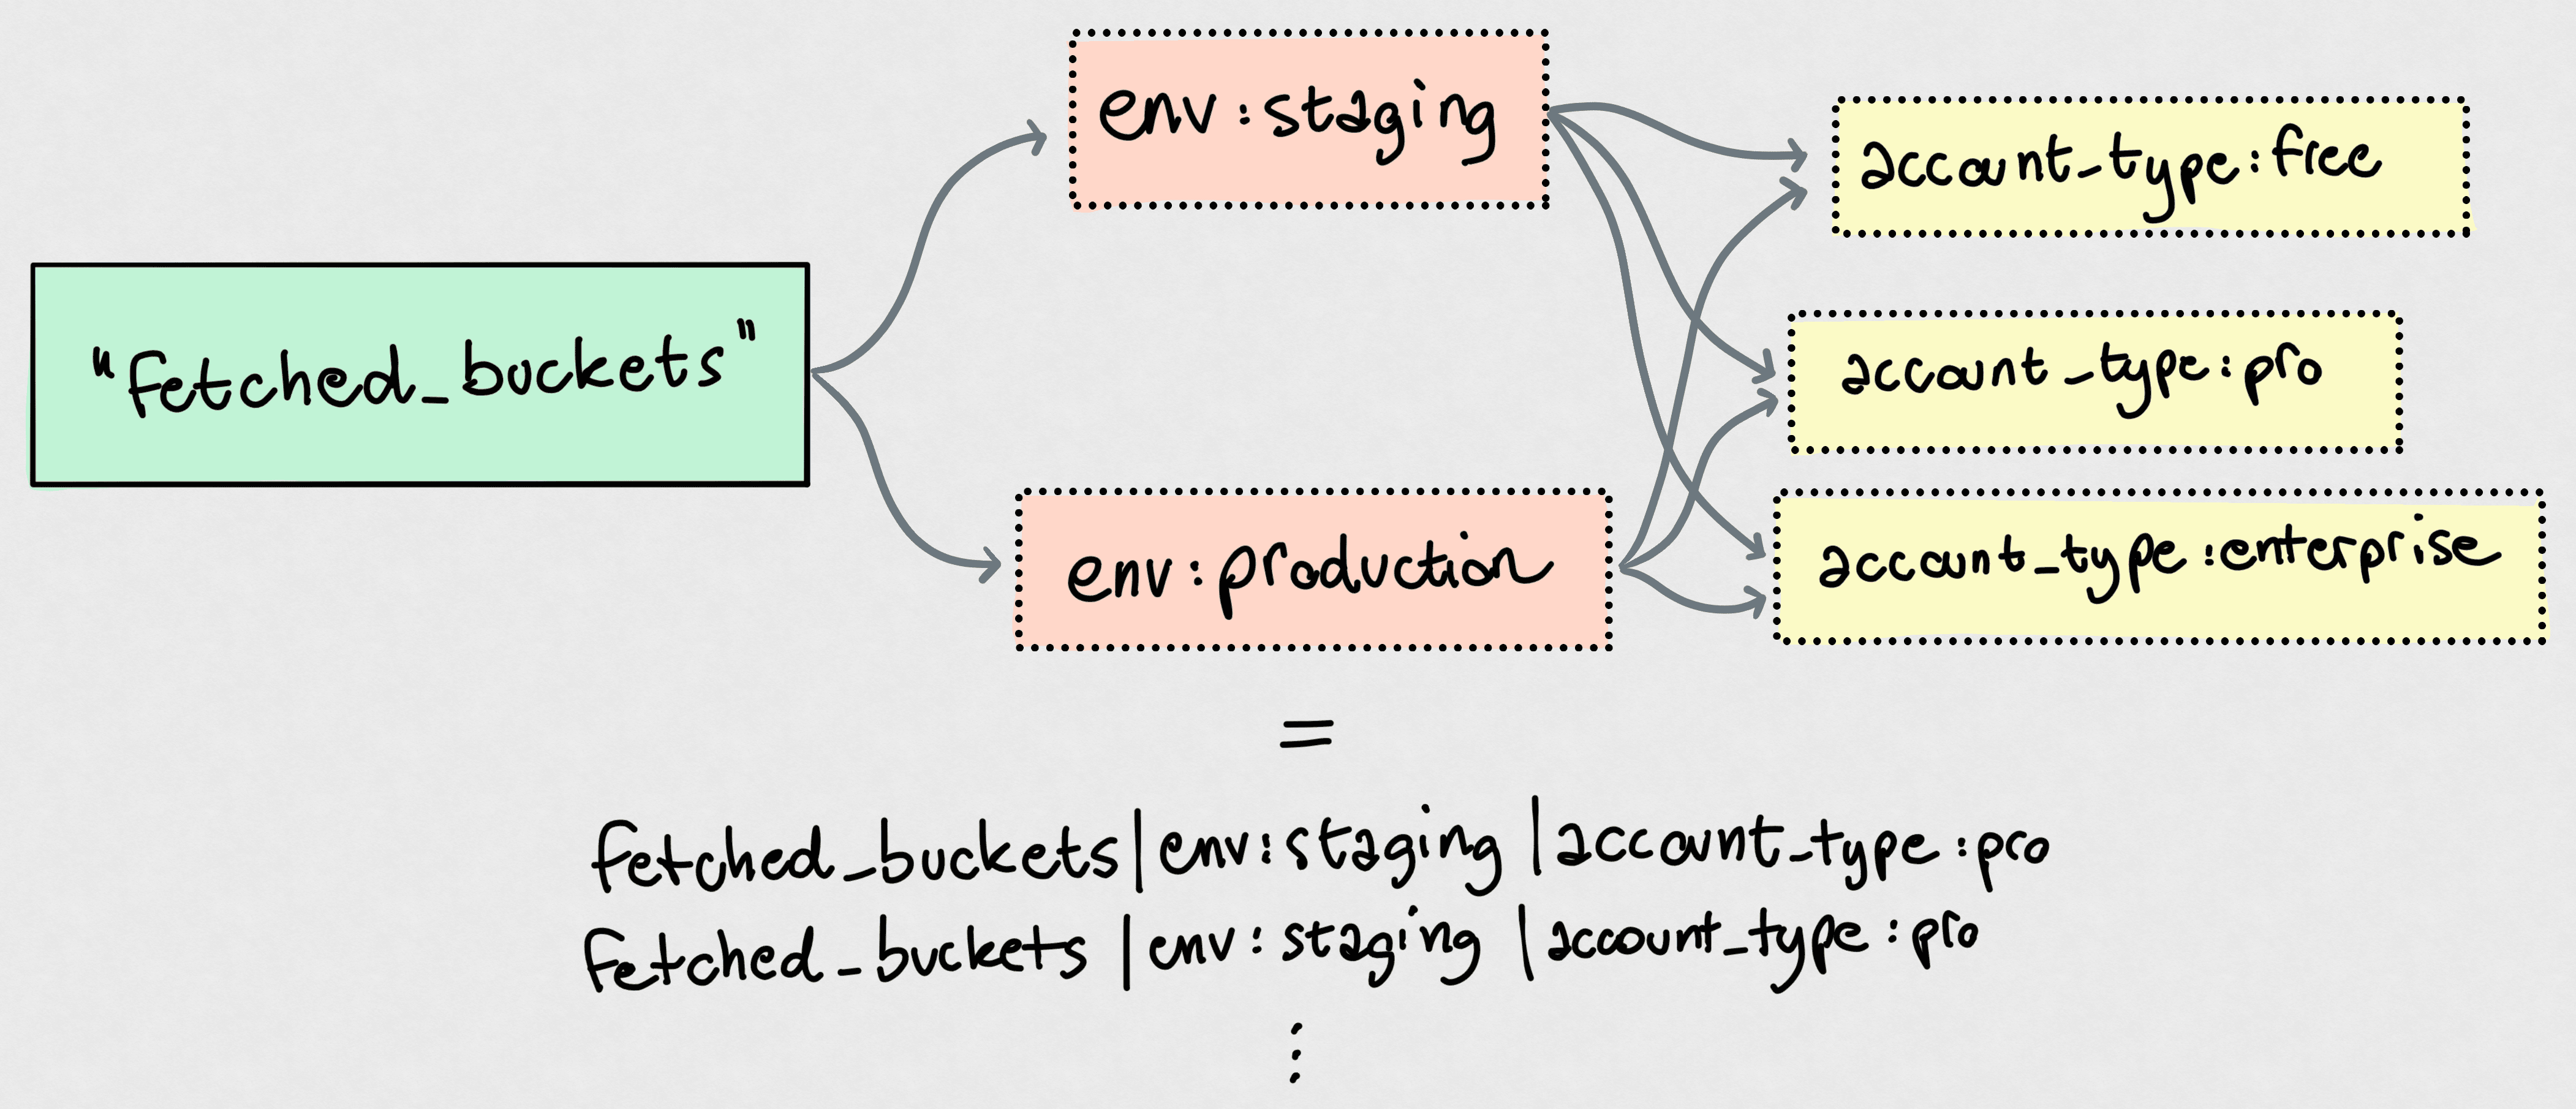
That's only a single counter metric, fetched_buckets. However, tag cardinality means you have:
- Two
envvalues - Three
account_typevalues
That means 2 × 3 = 6 unique custom metrics! You can easily see how that scales. If you add a backend tag to determine the storage buckets were fetched from, with say two values, you're essentially multiplying that 6 by yet another 2, landing on 12 custom metrics now. Really easy to explode.
High Cardinality Metrics
It's not really these "low-cardinality" metrics that cause issues. You'll end up with thousands of metrics this way, but that's quite a normal range for any Datadog-like service.
The problem is high-cardinality metrics. For example, the Datadog agent running on our Kubernetes nodes attaches a whole slew of tags to metrics, including a kube_node tag for the cluster node that the metric comes from. If you have many nodes, or scale nodes up and down, every metric goes up in cardinality.
For us, one of the main causes of problems was the pod_name tag, which we use to tag some of our metrics with the Kubernetes pod they come from. Application-level metrics don't generally benefit from such granularity, but there's a whole set of metrics that absolutely does: ones about the BEAM. Each pod runs its own Erlang node. Knowing the total number of running processes without slicing that by Erlang node is meaningless: great, you know you have 800k processes running on your cluster, but you'll never know if a pod runs amok and makes for a big chunk of that number.
The dilemma? If we have 100 pods running at any given time, that's every BEAM metric times 100. The explosion, though, is that repeats every time we deploy! New versions of the code cause new Docker images, which cause new pod names, which means 100 more unique combinations of each metric that is tagged with pod_name. Boom.
Data like this, however, is paramount for a platform team operating a system like this. It's critical during incident, to spot trends and patterns, and to understand what our system is doing. We don't want to give it up. If anything, we want more.
For example, recently we had to deal with some nodes running hot. BEAM's runtime inspection capabilities are fantastic. We jumped on the problematic boxes, fired up IEx, and snooped around using recon to our hearts' content. Nothing better than being able to do
biggest_offenders = :recon.proc_window(:reductions, 5, _ms = 1000)

# Now just get all the info + stacktrace to get some more context on these processes:
Enum.map(biggest_offenders, fn {pid, _reductions, _some_info} ->
  {pid, Process.info(pid)}
end)
on a live, running system and just get a peek at what's going on in there.
This is invaluable, but it's not the solution for constantly monitoring our systems. We have no historical data on, say, the five processes consuming the most memory at any given time.
Enter ClickHouse
ClickHouse is a really fast, columnar, OLAP database. It's a workhorse, and we use it to power product features, like segmentation or audit logs, and analytics. The most recent thing we were able to trivially ship thanks to ClickHouse was email.info, a breakdown of email provider performance: basically, we had ClickHouse chew through our provider delivery data and spit out analytics from that. It might not be that impressive on the surface, but I was baffled by how easy it was to go from thinking about doing this to live page.
Back to our BEAM analytics. My awesome coworker Victor, who got us all into ClickHouse in the first place, kind of opened a Pandora's box here: what if we store this high-cardinality, high-volume internal telemetry data in ClickHouse?
This makes so much sense. We can periodically sample the top-n processes based on some metric (memory usage, reductions, mailbox length) and dump a bunch of information about them in a ClickHouse table. We created a new internal_telemetry database and got to work. "Got to work" makes it sound way worse than it was: the whole thing was done in a few hours.
Table Design
We didn't spend too much time thinking about the table structure here. This is internal data that only we will be querying, so query performance is not the most important factor.
This is where we landed for the first iteration:
CREATE TABLE top_processes (
    metric LowCardinality(String),
    deployment LowCardinality(String),
    pod_name LowCardinality(String),
    timestamp DateTime64(3, 'UTC'),
    pid String,
    registered_name String DEFAULT '',
    current_function String DEFAULT '',
    initial_call String DEFAULT '',
    reductions UInt64,
    message_queue_len UInt32,
    memory UInt64,
    label String,
    memory_details Map(String, UInt128)
)
ENGINE = MergeTree
PARTITION BY toMonday(timestamp)
ORDER BY (metric, deployment, pod_name, timestamp)
TTL toDate(timestamp) + toIntervalDay(30)
SETTINGS ttl_only_drop_parts = 1;
Some notes:
metricis the metric we "found" this process through. For example,metric = 'memory'means that this row represents a process that was one of the top-n processes by memory usage at the time of scanning the system.deploymentis our Kubernetes deployment.- The TTL is there because we have not felt the need for this level of detailed metrics to be retained for months. ClickHouse takes care of dropping partitions older than one month here, so the whole thing doesn't explode in storage size. The funny thing is this though: storage is very cheap, and we mostly query over short time ranges; we could bump the
TTLto be much longer without paying much more. memory_detailsis a map so we can easily add to it later on without having to change the schema. This felt like the right compromise.
The rest of the columns should be self-explanatory.
The ordering key (ORDER BY) is one of the keys to ClickHouse queries. It lets ClickHouse find data quickly and scan as little as possible. A good rule of thumb is to go with increasing cardinality, which is exactly what we did here. The query patterns we expect to issue are mostly:
- For a single deployment, as it rarely makes sense to look at metrics aggregated over different applications.
- Most often for a single pod, to spot things going wrong within a given Erlang node.
- Focused on a window of time, thus the ordering by
timestamp.
An ordering key like this doesn't mean you cannot skip parts of it in your queries—it just means doing that results in less-optimized queries and data scans. If we'll ever find ourselves, say, querying all metric across all pod_name, we could easily deploy a materialized view that writes this data into a separate table optimized for that query pattern. Storage is cheap.
Periodically Dumping System State
Honestly, I was conflicted on whether I should even include this section. Nothing about this is new to anyone doing Erlang/Elixir!
We're just using the lovely telemetry_poller to collect and dump system state every few seconds. The child spec for it goes like this:
@doc """
Returns a child spec for a `telemetry_poller` that periodically
logs top processes.
"""
def child_spec([] = _opts) do
  Supervisor.child_spec(
    {:telemetry_poller,
     measurements: [{__MODULE__, :measure_and_persist, []}],
     period: to_timeout(second: 5),
     init_delay: to_timeout(second: 5),
     name: :top_processes_poller},
    id: __MODULE__
  )
end
Nothing fancy, at all. measure_and_persist/0 looks like what you probably expect it to look like:
  @doc """
  Collects top process data and writes it to ClickHouse.
  """
  def measure_and_persist do
    now = DateTime.utc_now()
    pod_name = System.get_env("HOSTNAME", "unknown")
    deployment = System.get_env("DEPLOYMENT", "<redacted>")

    rows =
      Enum.flat_map(@metrics, fn metric ->
        metric
        |> :recon.proc_count(@top_n)
        |> Enum.map(fn {pid, _value, _recon_info} ->
          build_row(pid, metric, now, pod_name, deployment)
        end)
        |> Enum.reject(&is_nil/1)
      end)

    if rows != [] do
      InternalTelemetryRepo.insert_all(TopProcess, rows)
    end

    :ok
  end
We use Ch as our ClickHouse driver, and ecto_ch to integrate it with Ecto.
That's the whole infrastructure for capturing this data, right there. build_row/5 is just a bunch of formatting and Process.info/2 calls. That's it!
In the Real World
This has been in production for just 10 days. Our top-n is 20: that is, we sample the top-20 processes over three metrics: reductions, message queue length, and memory. We sample every 5 seconds. Our total throughput in this table is:
$$ \frac{top{\text -}n \times metrics \times pod\_count}{sample\_interval} = \frac{20 \times 3 \times 100}{5s} = 1200 \space rows/s $$
Easy peasy for good ol' ClickHouse. Some stats from the live table:
- We have ~607M rows in
top_processes. Spare change for ClickHouse. - Compressed size of this table in object storage is just 5.64 GB (134.66 GB uncompressed).
Now for the fun part: queries! Let's just look at a couple of fun queries we were able to issue over the past few days.
Frequent Fliers
Find the processes that appear most often in the top-n processes by memory, over the past 24 hours. This could help find processes that consistently consume a lot of memory (rather than spiking once in a while).
SELECT
    concat('`', registered_name, '`') AS name,
    count() AS appearances,
    formatReadableSize(avg(memory)) AS avg_memory,
    formatReadableSize(max(memory)) AS max_memory
FROM top_processes
WHERE
  metric = 'memory'
  AND deployment = {deployment:LowCardinality(String)}
  AND registered_name != ''
  AND timestamp >= now() - INTERVAL 24 HOUR
GROUP BY registered_name
ORDER BY appearances DESC
LIMIT 10
FORMAT MARKDOWN| name | appearances | avg_memory | max_memory |
|---|---|---|---|
tzdata_release_updater | 362659 | 8.25 MiB | 8.55 MiB |
Elixir.Sentry.Sources | 362659 | 13.18 MiB | 13.18 MiB |
code_server | 362659 | 26.52 MiB | 51.77 MiB |
application_controller | 362659 | 10.23 MiB | 10.29 MiB |
ldclient_event_process_server_default | 362657 | 54.69 MiB | 283.01 MiB |
Elixir.<redacted>.K8sServer | 352357 | 10.03 MiB | 12.00 MiB |
ldclient_event_server_default | 349761 | 12.82 MiB | 39.39 MiB |
<redacted> | 286100 | 5.10 MiB | 7.88 MiB |
<redacted> | 275572 | 4.65 MiB | 11.58 MiB |
<redacted> | 242255 | 5.70 MiB | 12.80 MiB |
Just to give you an idea: this executed in 0.238s, scanning 7,389,364 rows (516.95 MB of data) 🤯.
Maximum Consumer Memory
This is useful to spot if there are any pods in a given deployment where the process consuming the most memory is consuming more than the top memory hog in the other pods.
SELECT
    toStartOfMinute(timestamp) AS minute,
    pod_name,
    max(memory) peak_memory
FROM top_processes
WHERE metric = 'memory'
  AND deployment = {deployment:LowCardinality(String)}
  AND timestamp >= now() - INTERVAL 3 HOUR
GROUP BY minute, pod_name
ORDER BY minute;
ClickHouse Cloud has decent charting functionality, and this type of query spits out very easy-to-spot-stuff-on charts. Here's what it looks like, over time, broken by pod (with no runaway processes):
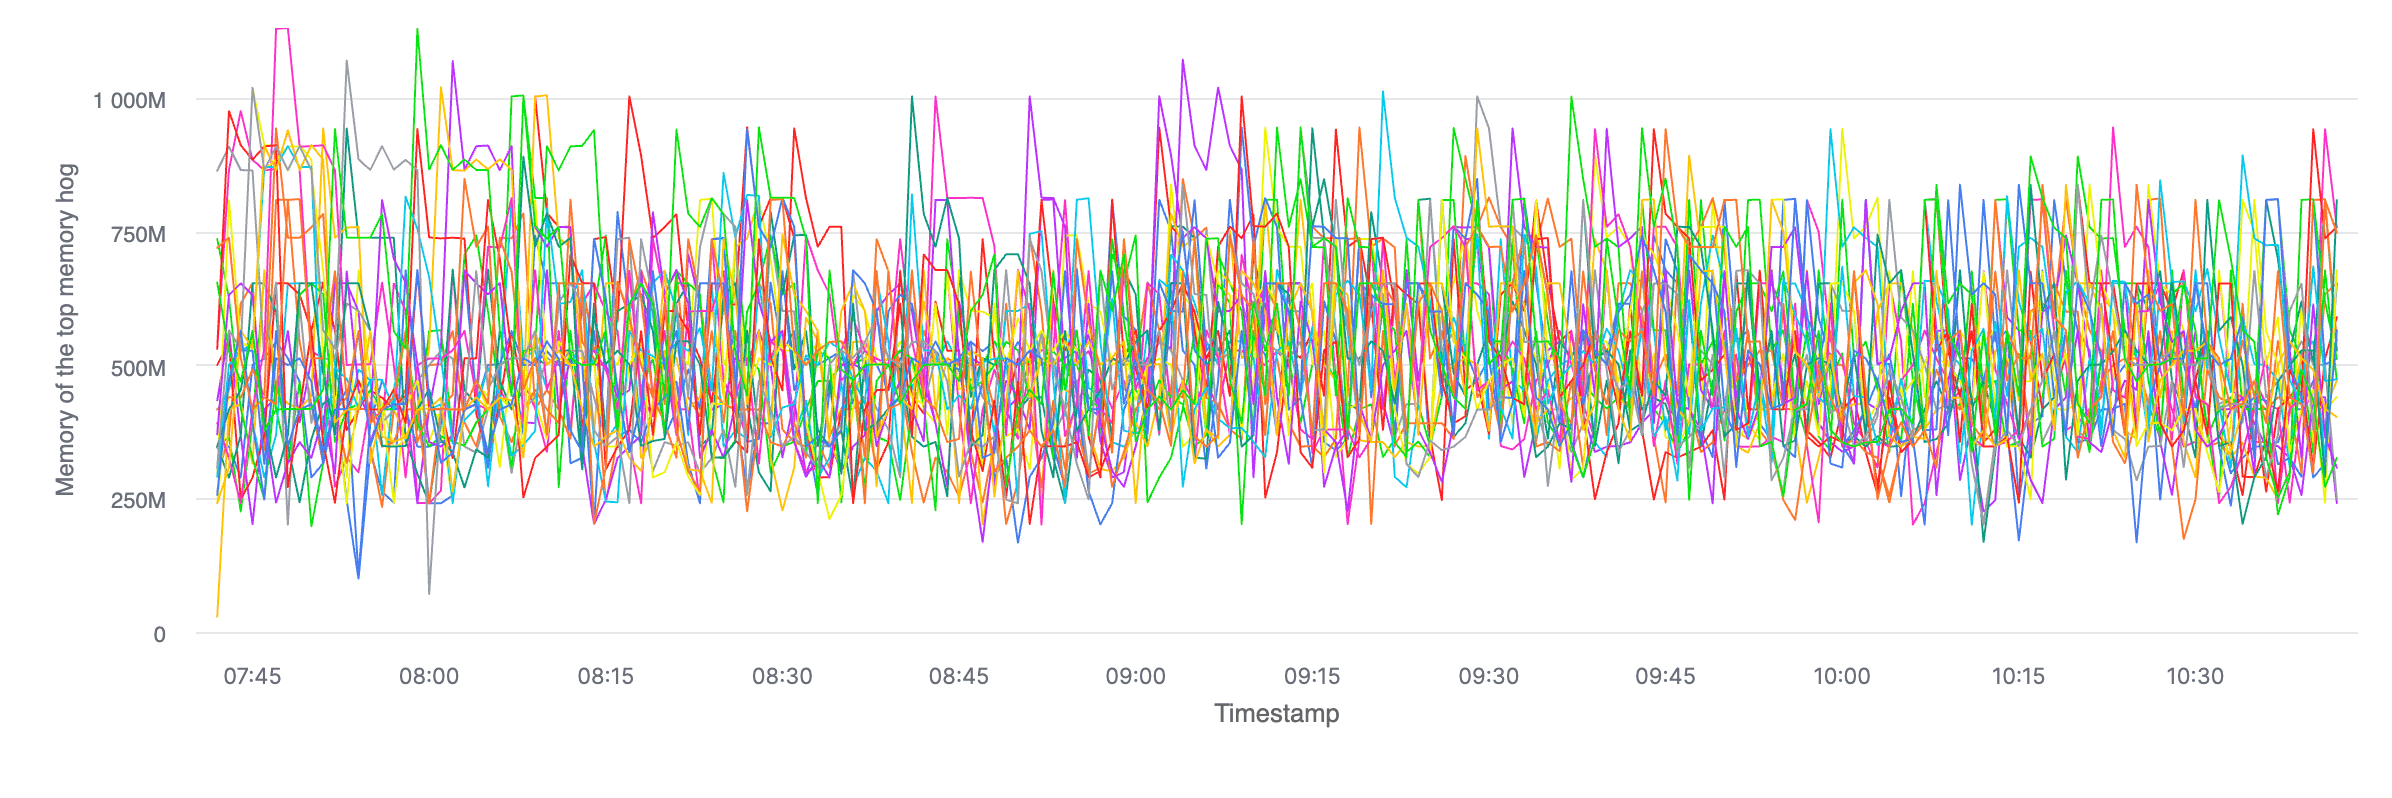
Also, I can't help but share this: even when forcing the query to avoid any caches (SETTINGS use_query_cache = false), this query returned in 42 milliseconds, reading 1,131,629 rows (21.51 MB of data). It never gets old.
Conclusion
I’m aware that using ClickHouse for this type of stuff isn't groundbreaking. ClickHouse is mostly sold as an analytics database, so much so that there's a whole product called ClickStack to store and query OpenTelemetry data. This is truly ClickHouse's bread and butter.
What I described in this post is just what I found to be a perfect use case. BEAM is easy to inspect (or "self"-inspect) at runtime, making this whole thing trivial.
Just to recap, we talked about:
- Why high-cardinality metrics are hard to store in metric products (like Datadog in our case).
- How we overcame this by storing lots of detailed data about the runtime of the BEAM in ClickHouse.
- A couple of example queries we ran that show the potential use cases of something like this.
I did not explicitly close the cost loop here because storage cost with ClickHouse, at least at this scale, is negligible. At the time of writing, ClickHouse charges something like USD$25/TB/mo in us-east-*. Even if we grow the size of our stored internal metrics 100 times what it is today, we'll be storing half a terabyte of data and paying less than a single ChatGPT Plus subscription. There are obviously egress and compute cost to factor in, but those are only relevant when we query the data; with five engineers on the platform team only having to look at this data once in a while, that cost amounts to zero for all intents and purposes.
I want to give another shout out to my colleague Victor, who essentially came up with this whole idea.
Thanks for reading!